See what your team can publish in a week
In a short demo, see how trusted location data becomes publish-ready content your team can use immediately.
Localintel’s AI-powered platform turns trusted data about your community into ready-to-use charts, maps, dashboards, stories, reports, and website embeds – so every department can publish and respond faster, without extra steps or delays.


.png)


Whether it’s a report deadline, a council request, an investor inquiry, or a website update, government teams are stuck in the same cycle: hunting for data, building charts and maps, writing explanations, and trying to make it look professional - again.
The data you need is spread across public, licensed, and internal sources, making it harder to find and reuse.
Turning raw data into reports, charts, maps, and narratives that are ready to share takes too long.
Waiting on other teams for data and visuals causes delays, while relying on consultants drives up cost.
Generic AI tools can’t be safely used for internal or external documents, making outputs hard to verify, approve, or defend.
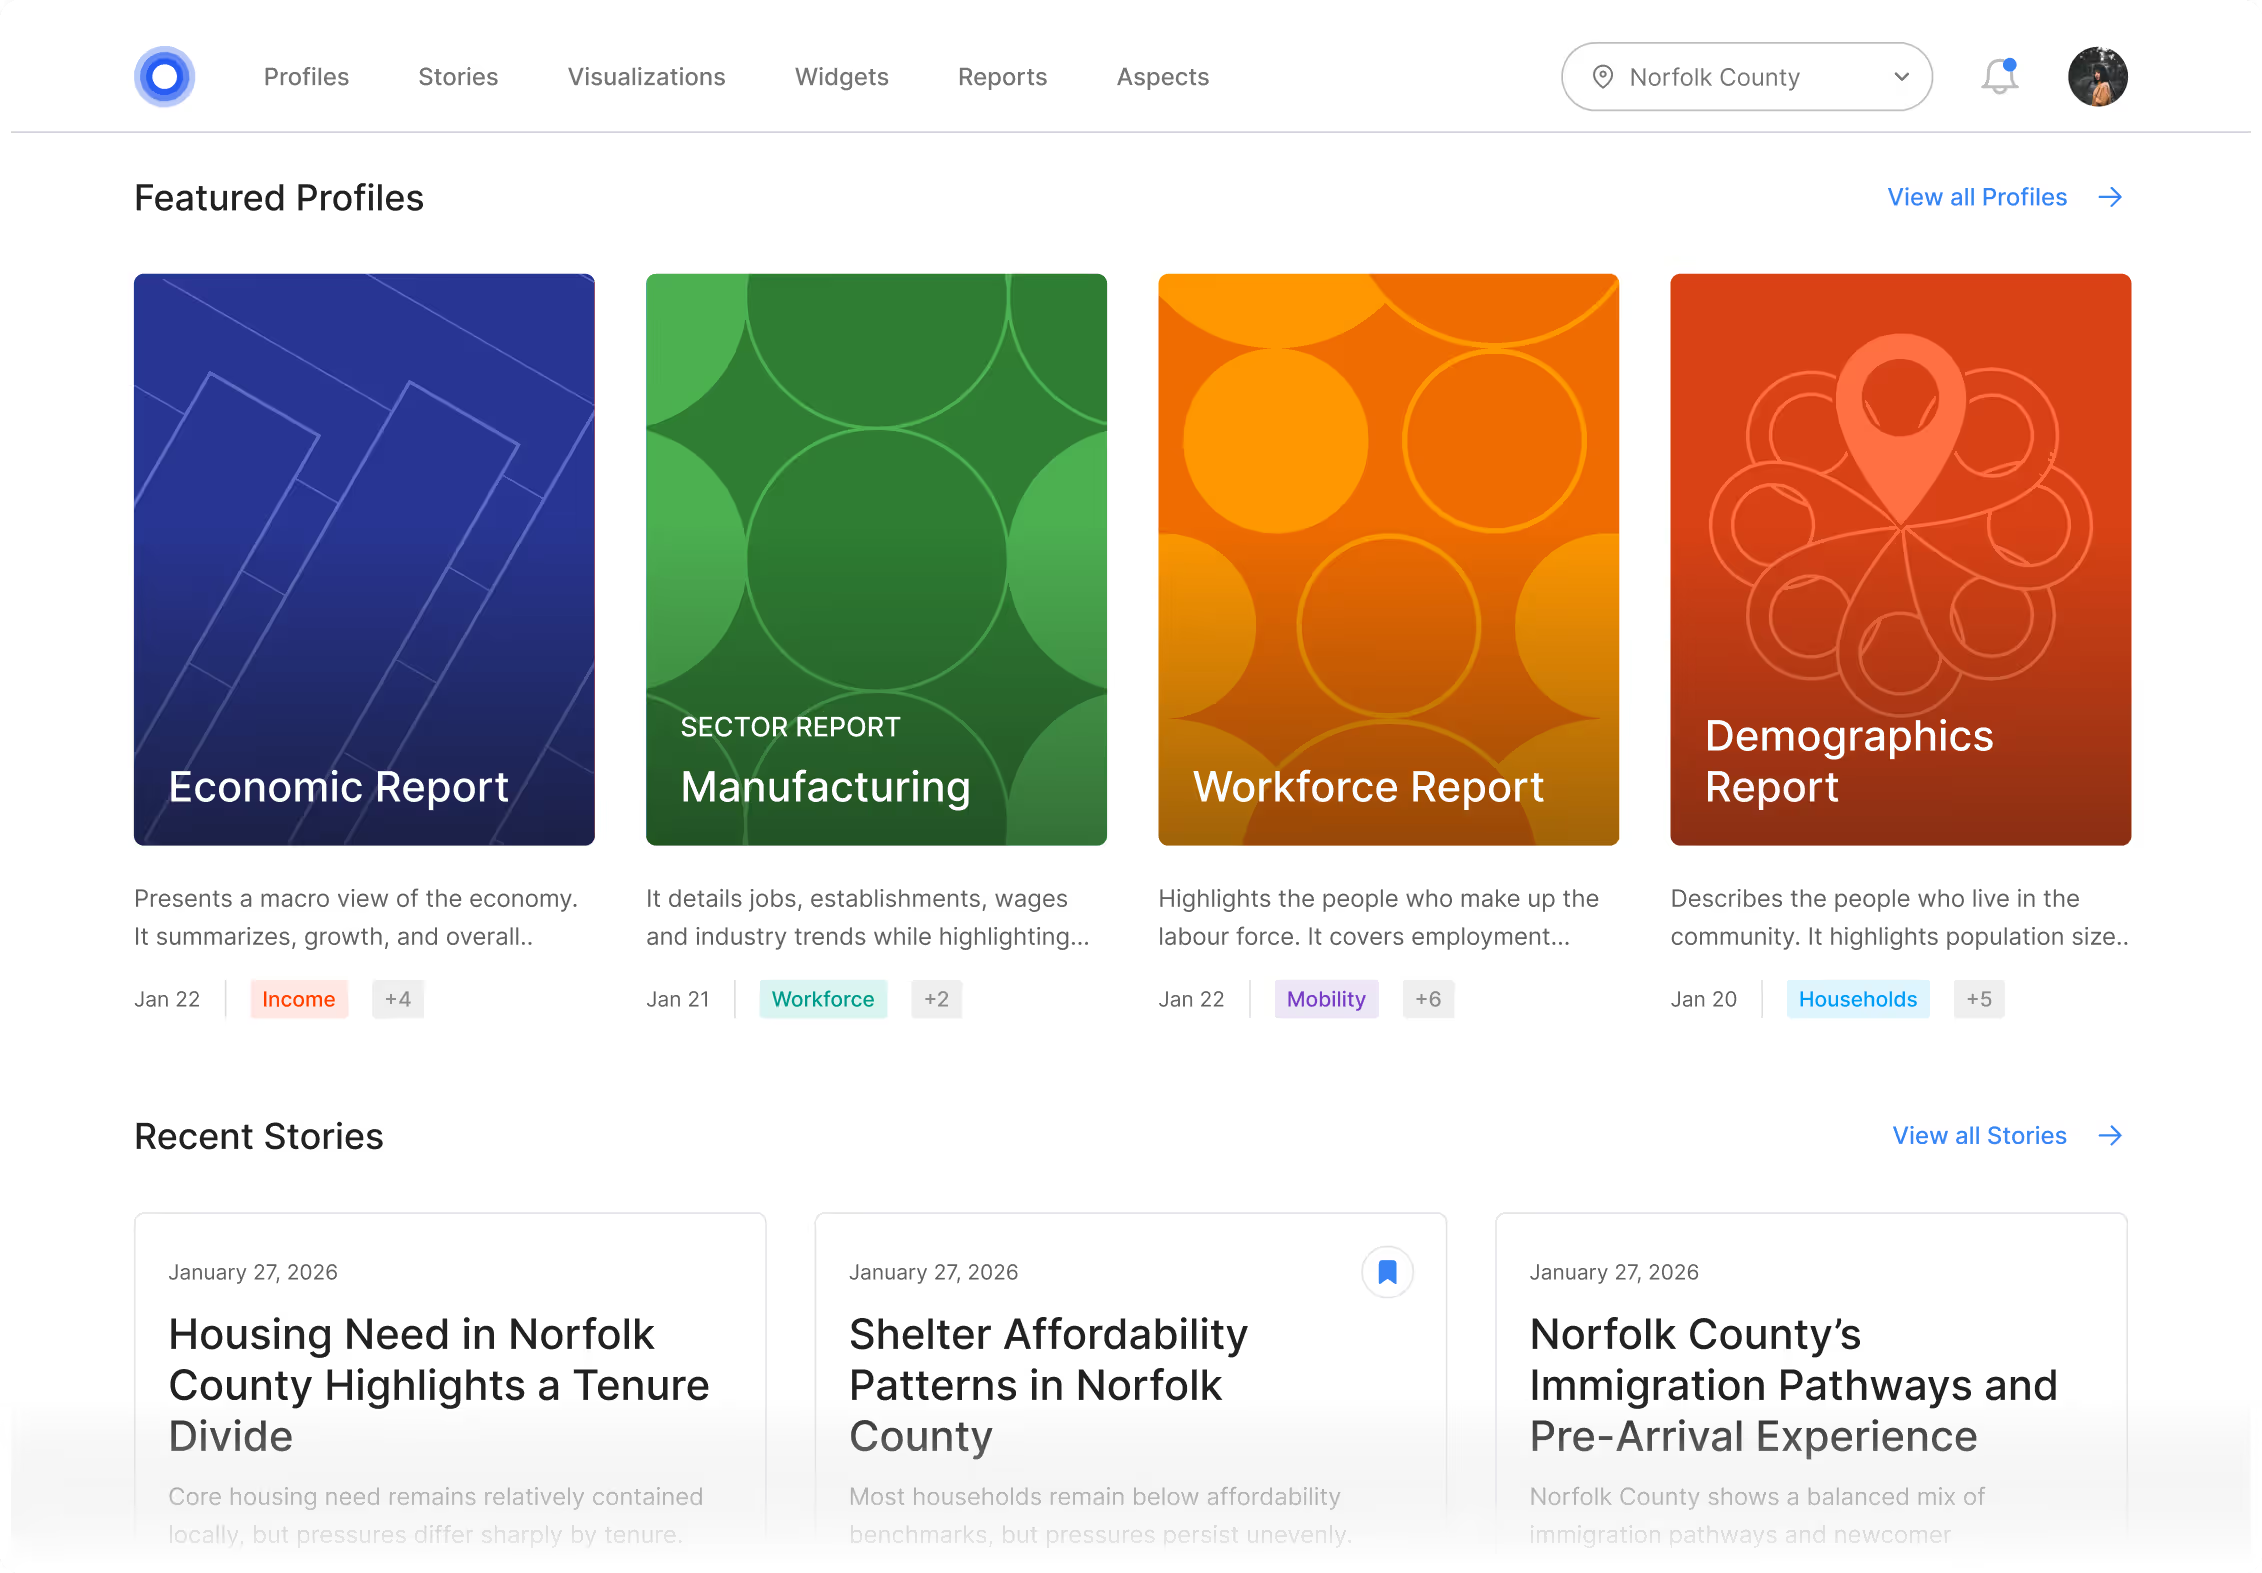
Localintel is a secure, AI-powered platform that automatically turns trusted, up-to-date data about your community into ready-to-share content – reports, charts, maps, dashboards, stories, insights, and website embeds – so teams can publish and respond in minutes instead of starting from scratch.
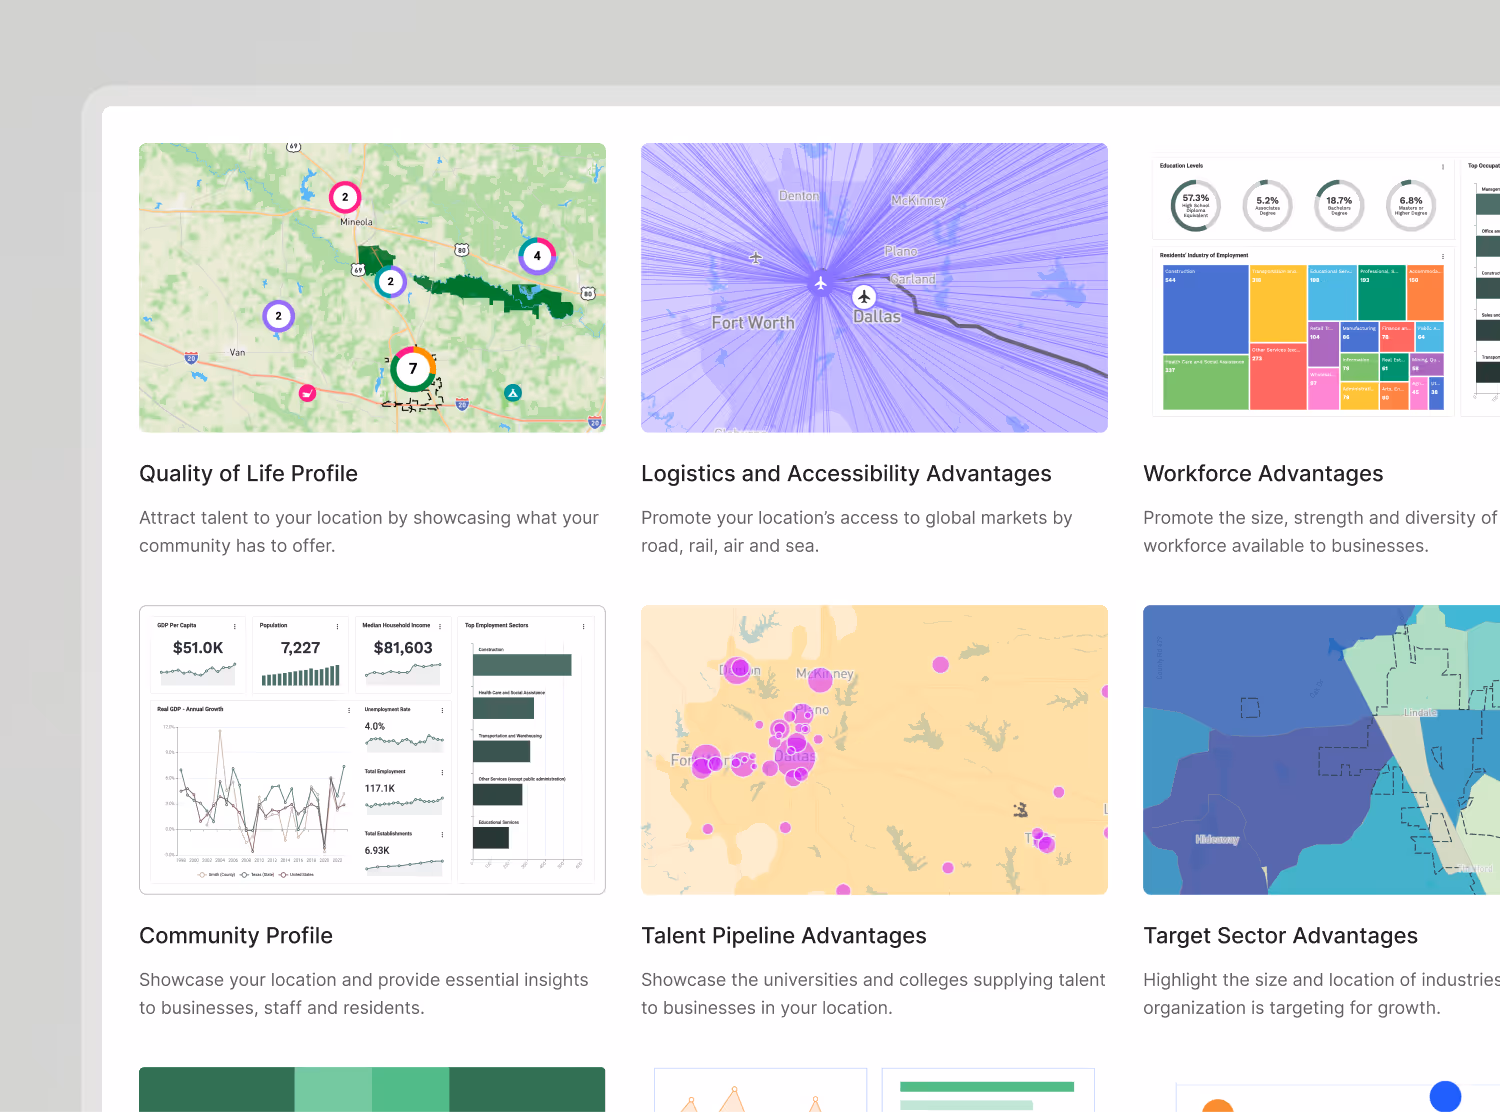
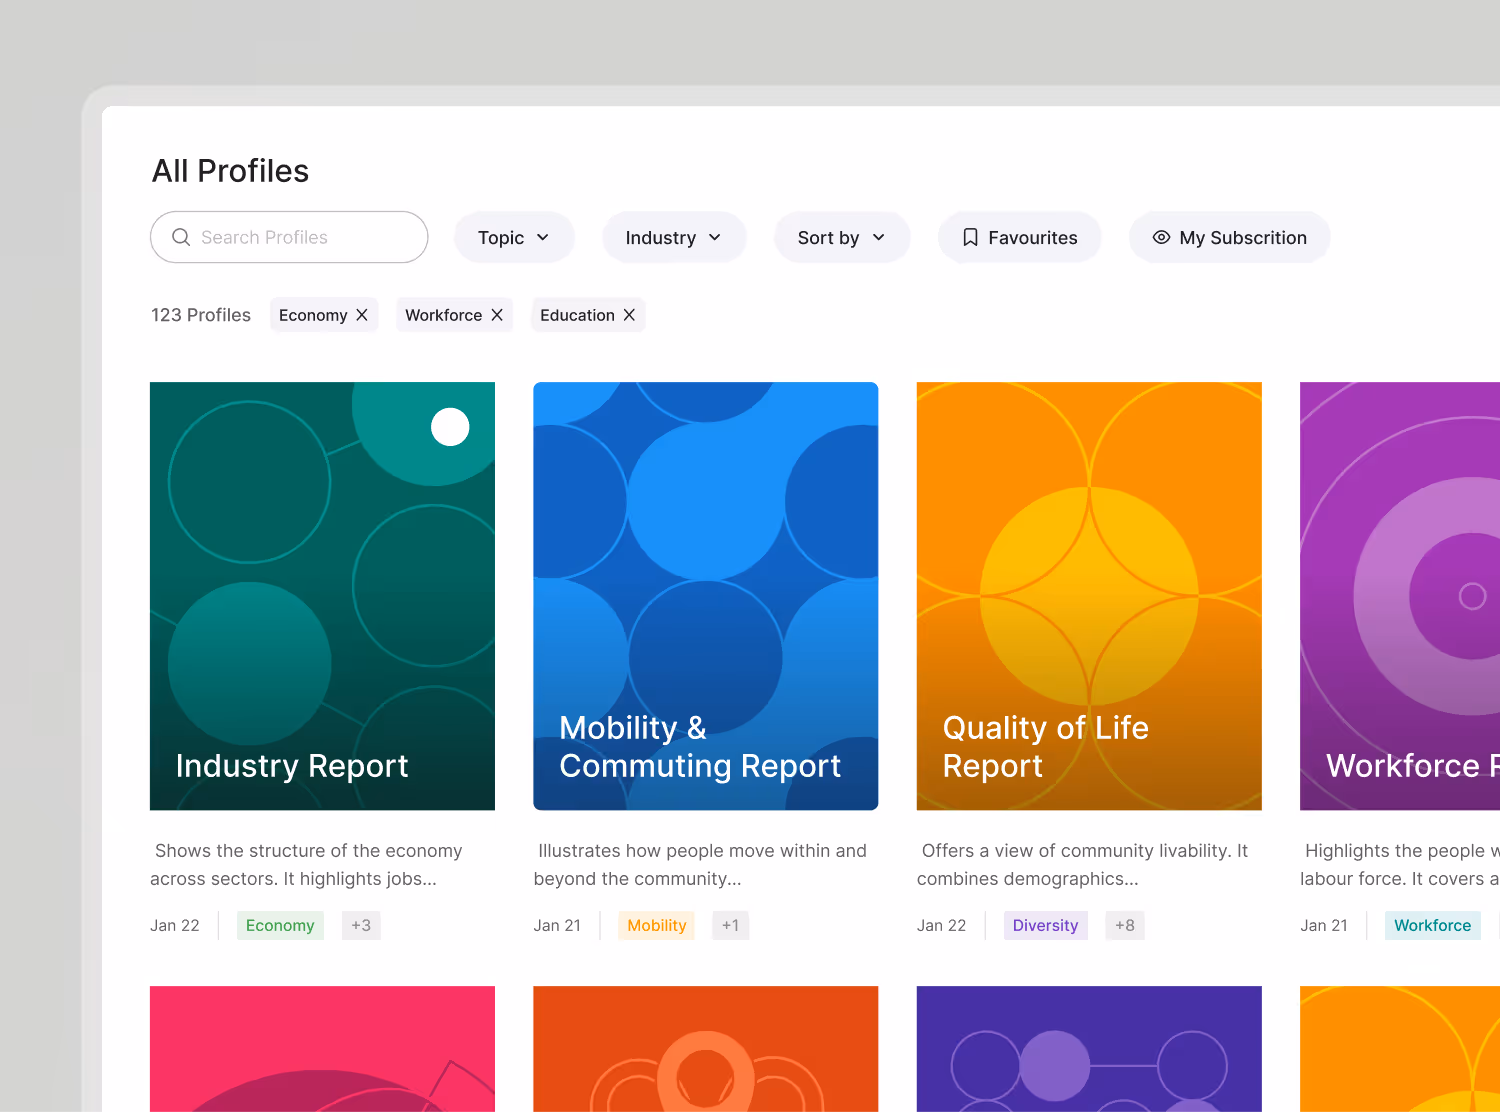
A catalog of charts, maps, dashboards, insights, stories, reports and embeds you can drop straight into presentations, websites, inquiry responses, grants, and documents.
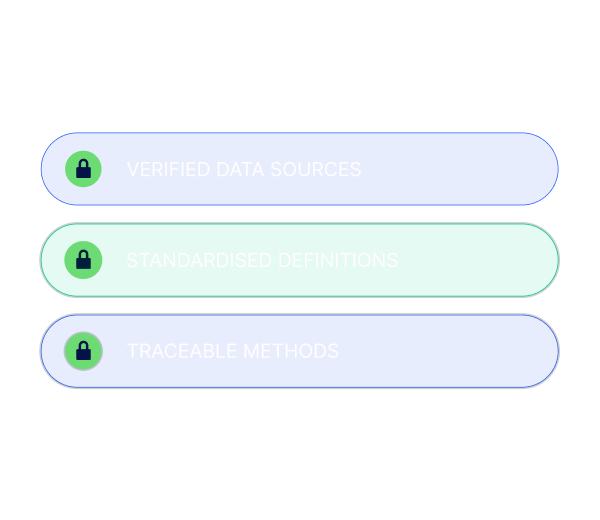
Curated public and licensed datasets, cleaned, standardized, and kept current with clear sourcing.
Create credible outputs across teams without specialist tools, training, or support.
Every output from the Platform is built from trusted data that’s kept up to date and fully sourced, so you can publish with confidence using a repeatable workflow that fits your existing review and approval process.


Easy to use in three simple steps, even if you’re not a data expert or someone who builds charts, maps, or web tools.
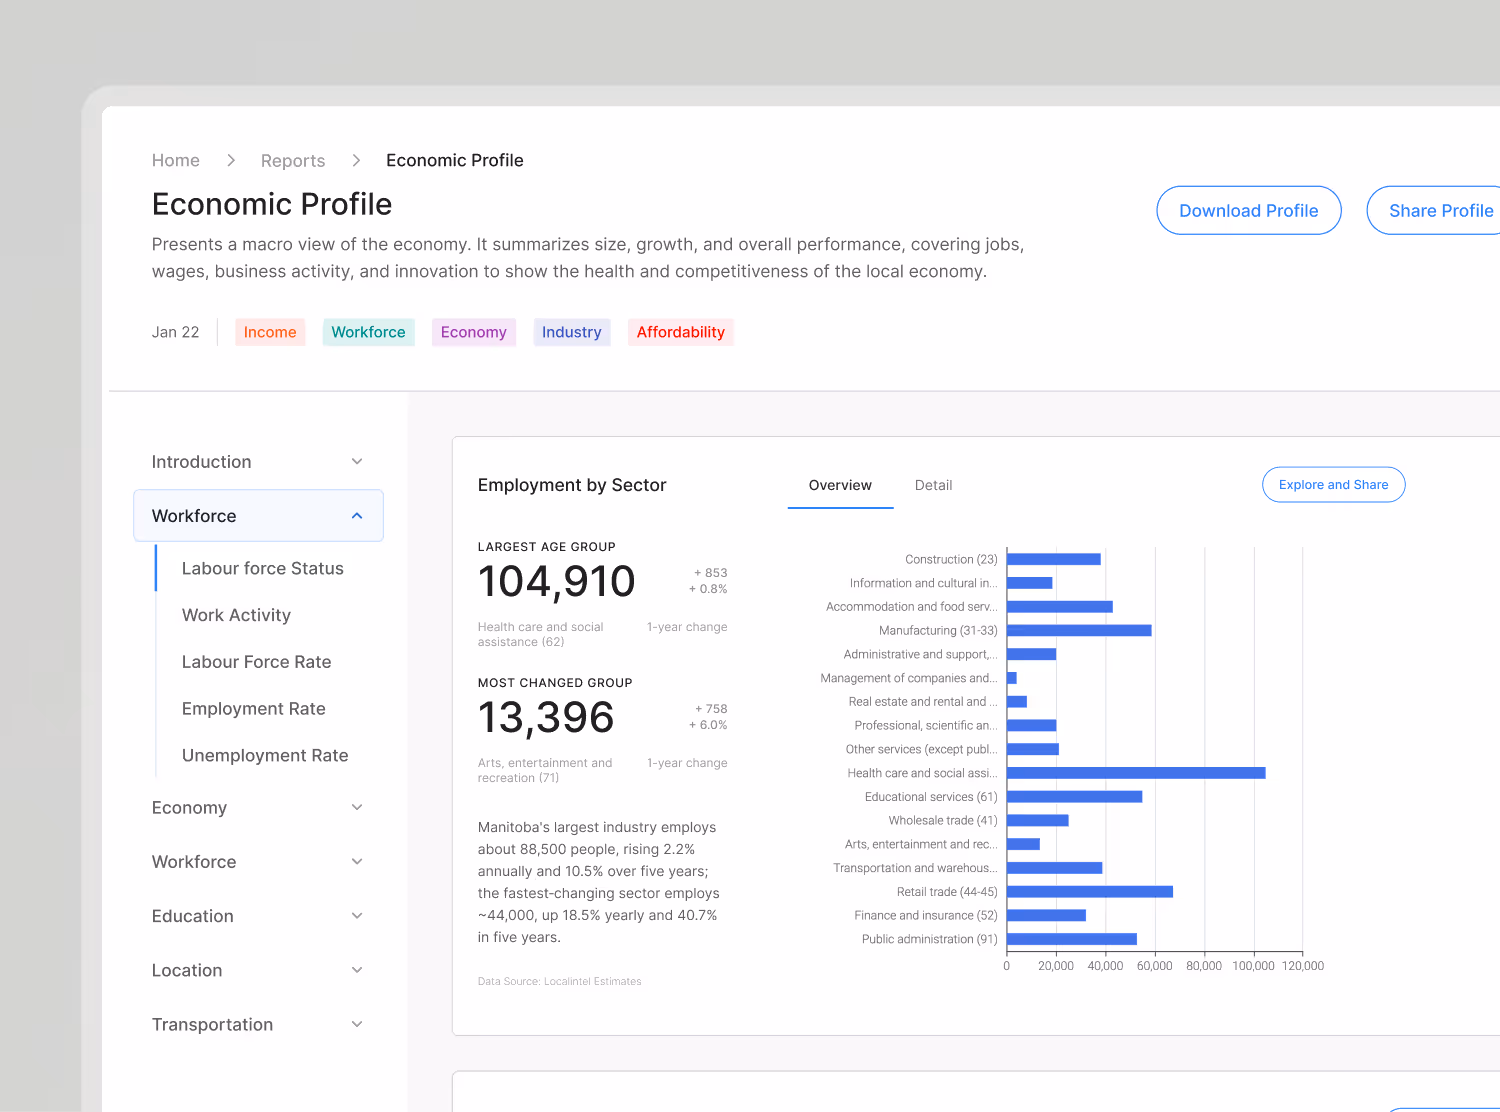
Select the place and the story you need to tell – economy, housing, workforce, quality of life, growth, and more.
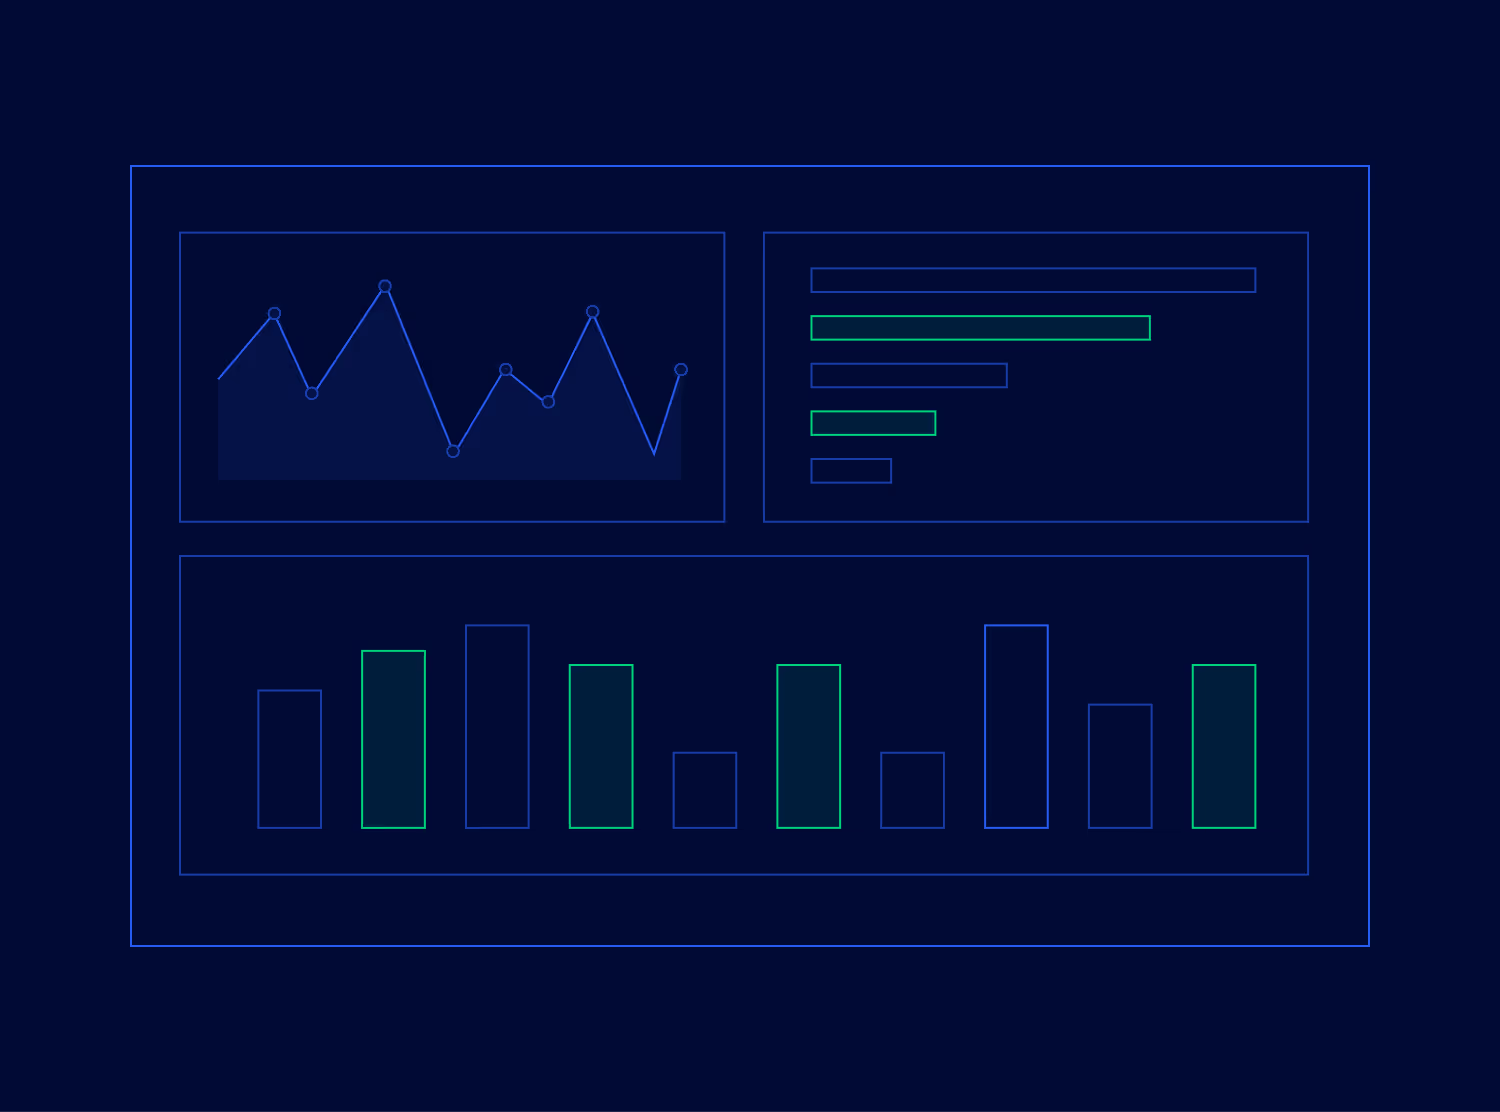
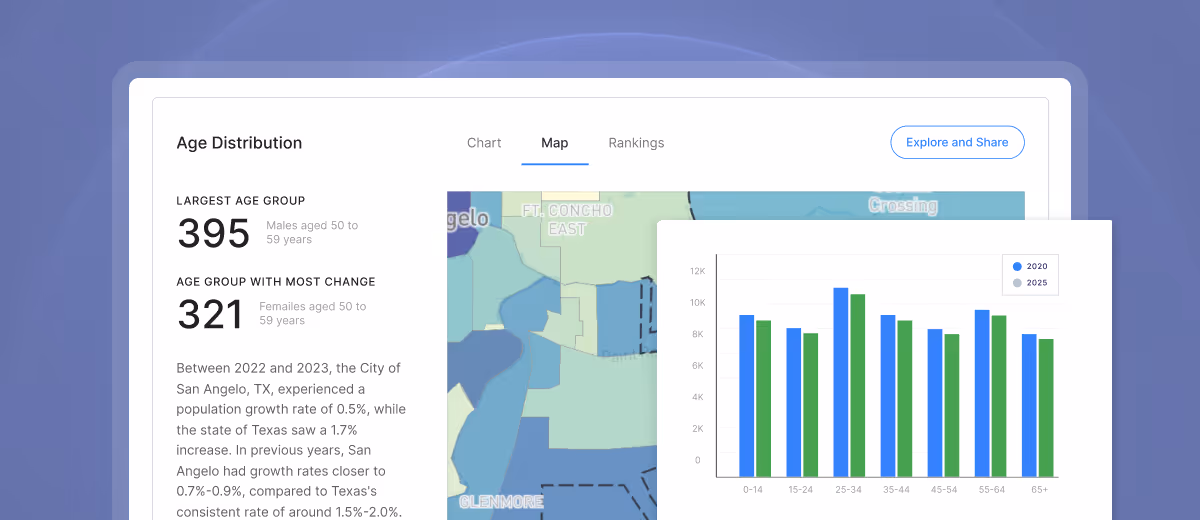
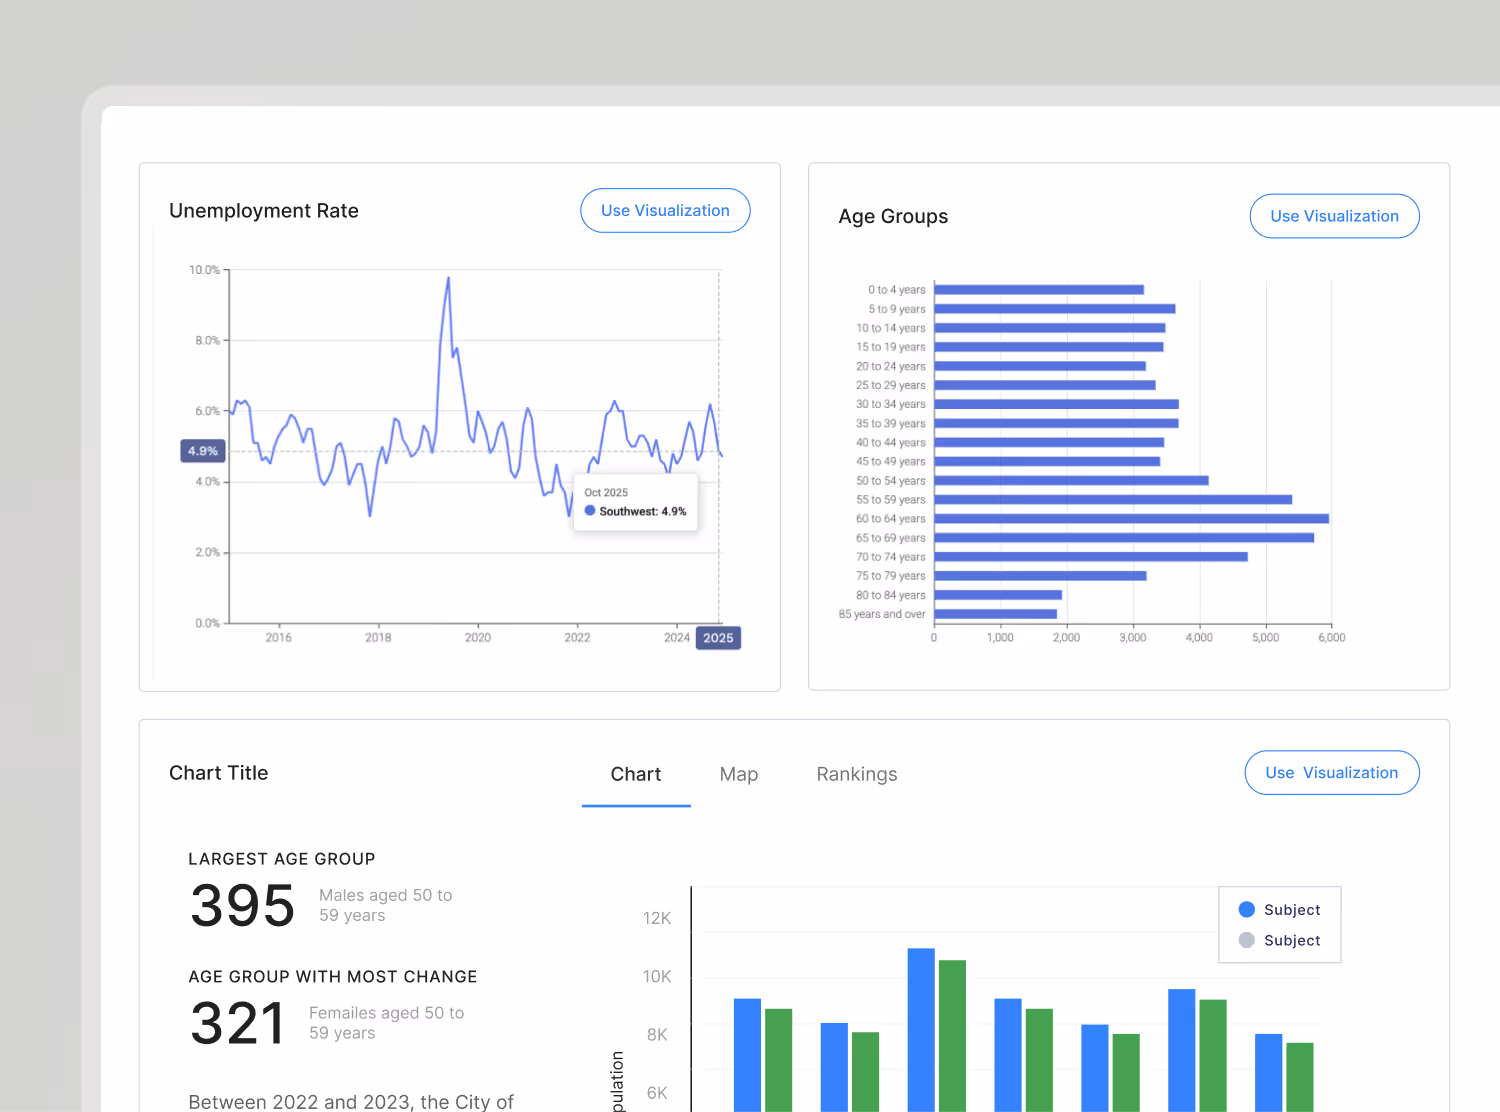
Explore dashboards, charts, maps, reports, stories, and website embeds – built from governed data with clear sourcing.

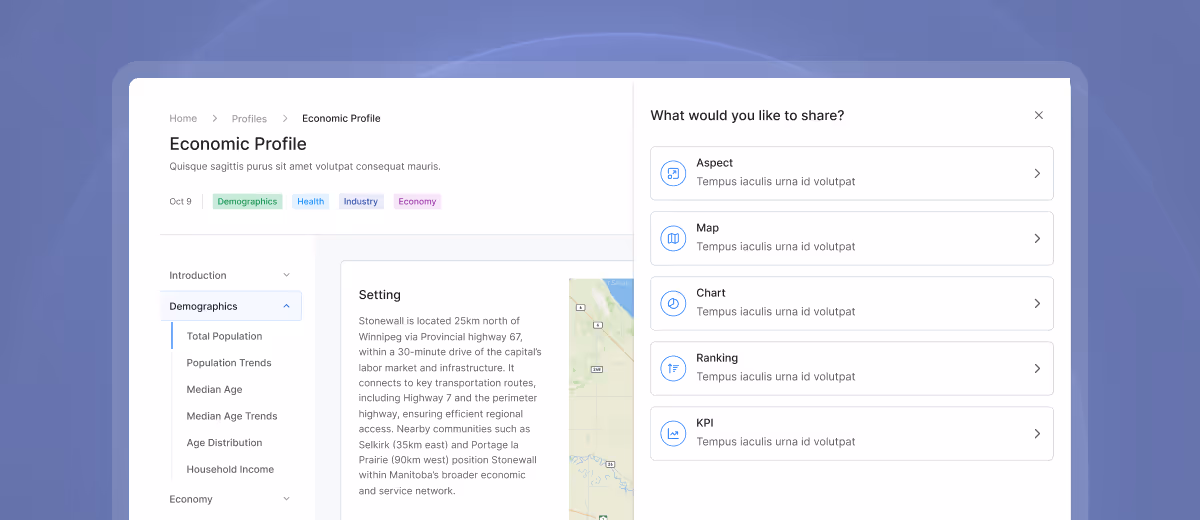
Export for presentations and reports, use in newsletters and emails, or embed on your website to keep key pages current.
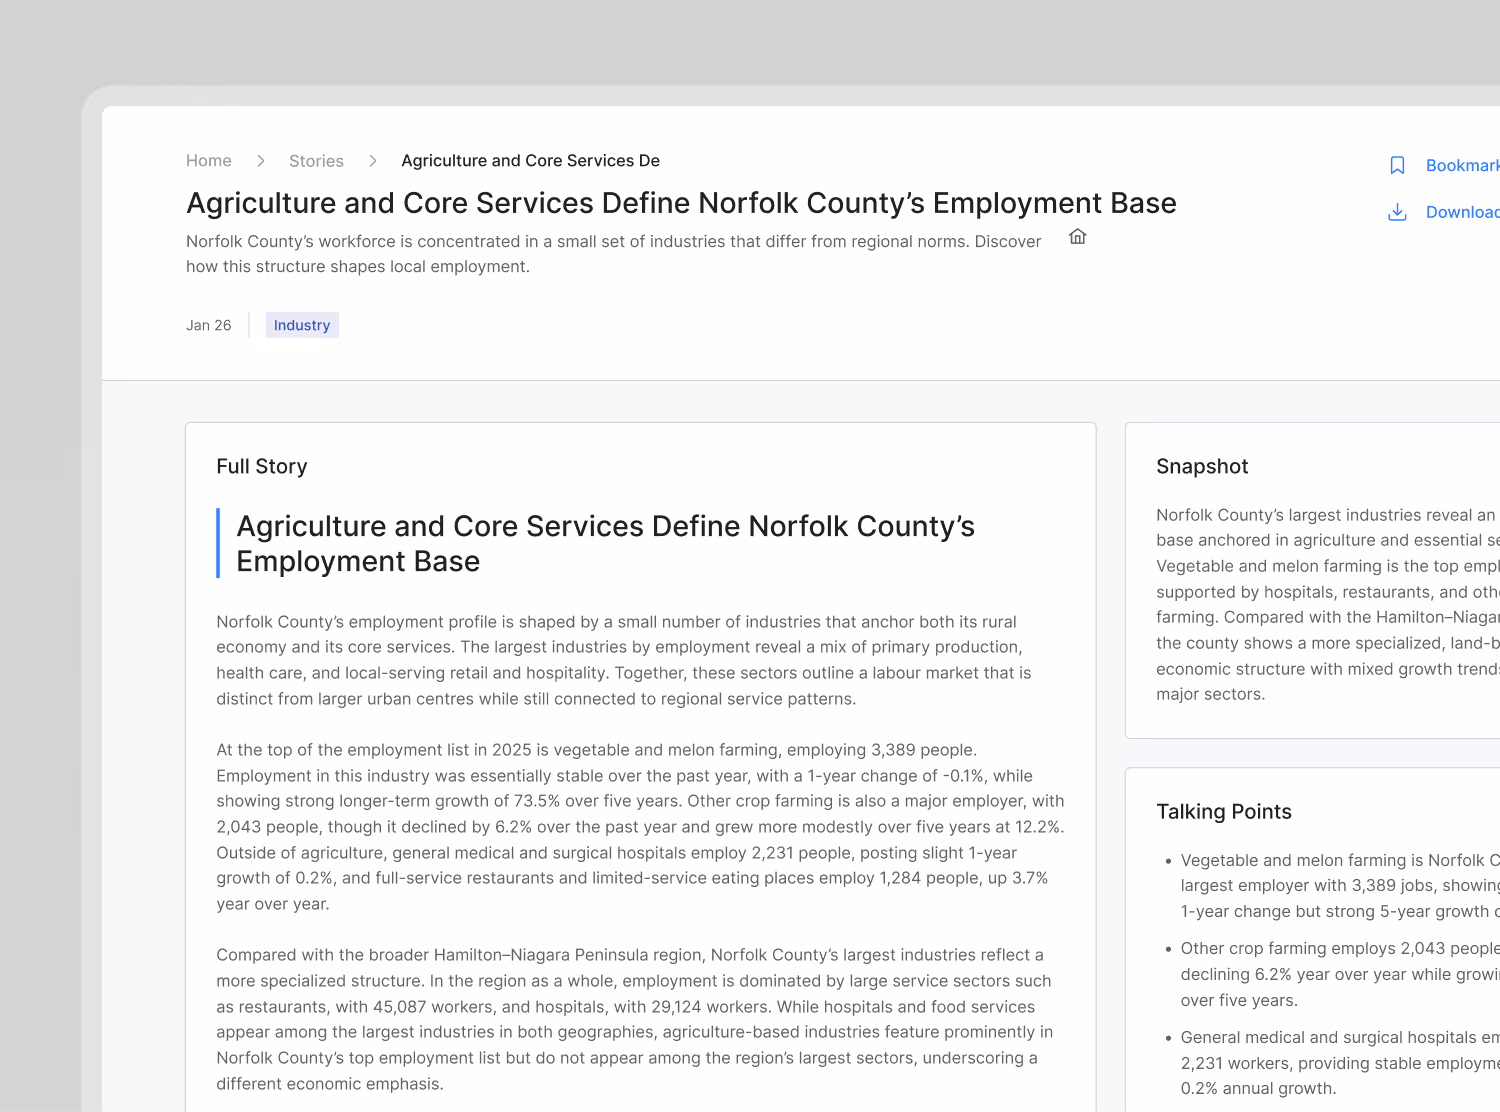
Everyone is talking about using AI for economic development, but Norfolk County has already put it to work. In their first week with Localintel’s location content platform, the team published a data-rich news article and responded to stakeholder questions in minutes, not days.

One ready-to-use platform for every public-sector team that needs to communicate clear, credible, place-based information.
Use ready‑to‑share dashboards, charts, maps, reports, website embeds, stories, and insights to answer RFIs faster, support investor conversations, keep your website and collateral current, and prepare newsletters and presentations without starting from scratch.
Create staff reports and public-facing materials faster with credible maps, charts, and plain-language narratives for plans, studies, and rezonings – built to hold up in public review.
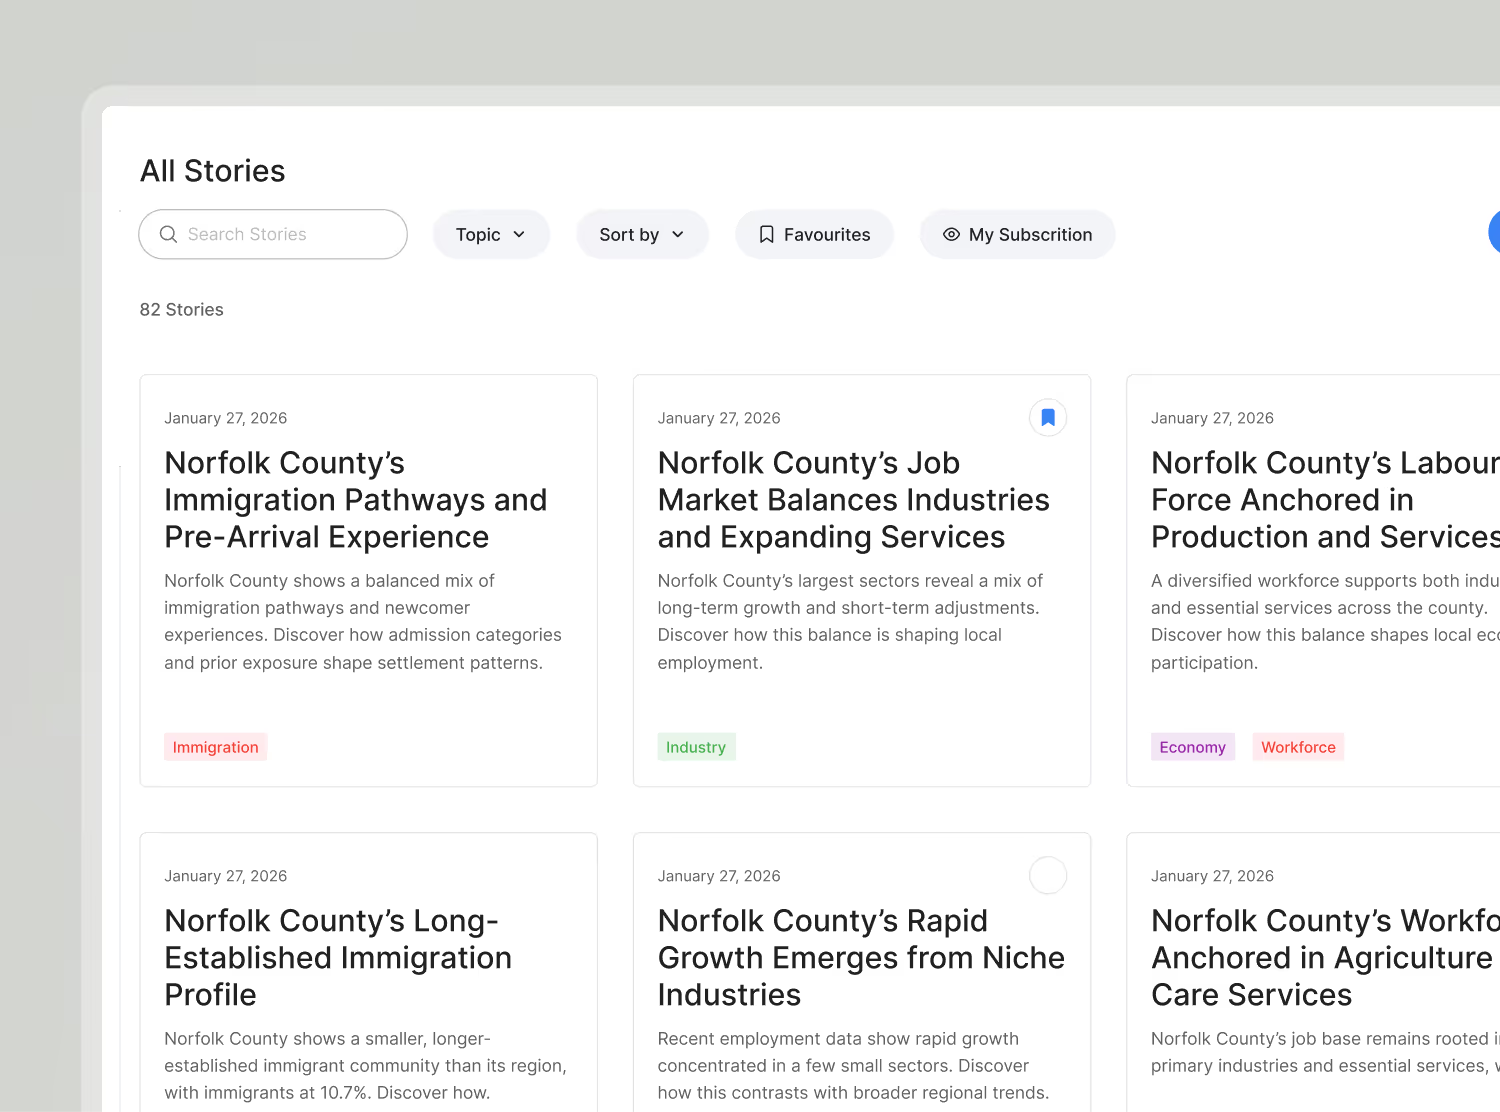
Browse a library of sourced visuals and plain‑English stories to explain “what’s happening where” across web, social, newsletters, and public updates.
Show who your facilities serve and why investments matter using data-backed visuals and narratives for grants, master plans, capital requests, reporting, and community engagement.
Build council-ready context for capital decisions (CIP, bonds, grants) with maps and briefing materials that answer why this project, here, now.
Strengthen applications and progress reports with export-ready charts, maps, and narratives, without manual data wrangling.
Align departments around a shared set of indicators and a defensible narrative for budgets, strategic planning, and high-stakes briefings.
Explain budget choices and trade-offs to council and residents with consistent visuals and plain-language context.
Reduce one-off data requests and support consistent public reporting with a governed, secure platform built for reliable, repeatable outputs.
One platform for every public-sector team that needs to communicate clear, credible, place-based information.

Use ready‑to‑share dashboards, charts, maps, reports, website embeds, stories, and insights to answer RFIs faster, support investor conversations, keep your website and collateral current, and prepare newsletters and presentations without starting from scratch.

Create staff reports and public-facing materials faster with credible maps, charts, and plain-language narratives for plans, studies, and rezonings – built to hold up in public review.

Use ready‑to‑share dashboards, charts, maps, reports, website embeds, stories, and insights to answer RFIs faster, support investor conversations, keep your website and collateral current, and prepare newsletters and presentations without starting from scratch.
Use ready‑to‑share dashboards, charts, maps, reports, website embeds, stories, and insights to answer RFIs faster, support investor conversations, keep your website and collateral current, and prepare newsletters and presentations without starting from scratch.
Use ready‑to‑share dashboards, charts, maps, reports, website embeds, stories, and insights to answer RFIs faster, support investor conversations, keep your website and collateral current, and prepare newsletters and presentations without starting from scratch.
Use ready‑to‑share dashboards, charts, maps, reports, website embeds, stories, and insights to answer RFIs faster, support investor conversations, keep your website and collateral current, and prepare newsletters and presentations without starting from scratch.
Use ready‑to‑share dashboards, charts, maps, reports, website embeds, stories, and insights to answer RFIs faster, support investor conversations, keep your website and collateral current, and prepare newsletters and presentations without starting from scratch.
Use ready‑to‑share dashboards, charts, maps, reports, website embeds, stories, and insights to answer RFIs faster, support investor conversations, keep your website and collateral current, and prepare newsletters and presentations without starting from scratch.

Reduce one-off data requests and support consistent public reporting with a governed, secure platform built for reliable, repeatable outputs.
Get publish-ready content that’s already built and ready to drop into presentations, websites, reports, and emails. No reformatting, redesigning, or manual data wrangling.
Reduce reliance on consultants and specialist teams by using a repeatable workflow. What once took days or weeks can now be created in a fraction of the time.
Produce polished, brand-ready charts, maps, reports, and stories without extra hires. Every output is consistent, credible, and built on trusted data with clear sourcing.
The data-driven content engine built for public-sector communication, where accuracy, sourcing, and defensibility matter.
Grounded in governed data: Built on curated public and licensed datasets, cleaned, standardized, and kept current with clear definitions and provenance.
AI you can defend: Outputs are generated from the governed layer so you can trace charts, maps, and narratives back to sources and methods.
Fits your approval process: Your existing review workflows stay in place – the platform simply makes it faster to produce consistent, defensible materials.
Complements GIS and BI: Keep specialist tools for deep analysis. Localintel turns results into publish-ready outputs for non-technical teams.
Plays well with existing platforms: Works alongside your data systems and site-selection tools; you can adopt it department-by-department.
Widgets are part of the platform: The website embed tools trusted by hundreds of organizations are now integrated into the Localintel platform.
No disruption: Your Localintel tools and embeds (now called widgets) keep running as they do today, with a clear path to add the new platform when you’re ready.
More in one place: Profiles, visuals, stories, and website embeds come together in a single workflow, so you spend less time stitching tools and files together.
Better outputs over time: Polished, brand-ready publishing from day one, with deeper branding controls expanding over time.
Start where it hurts most: Use Localintel where turning data into content is slowing you down, inquiries, council papers, or key web pages.
See what you can publish: We’ll show the specific reports, charts, maps, stories, and embeds you could use in your work.
Adopt at your pace: Start with one team or one high-value workflow, then expand as more teams see the value.
Today’s municipal staff are under pressure to turn complex data about their community into accurate, engaging content – without the time or tools to do it well. Our new platform provides ready-to-use charts, maps, profiles, and explanations that staff can drop directly into reports, presentations, websites, requests for information, and more. Save hours.
Communicate with confidence. Speak with one voice across the organization.
Welcome to a whole new way to communicate your location’s advantages.